
Knowing that SQL Server has blocking or deadlock problems is still quite easy. You usually notice this in the application, and with the right queries, you can also display the corresponding blocking chains. The simplest way to do this is with http://whoisactive.com.
SELECT
    blocking_session_id   AS blocking_session,
    session_id            AS blocked_session,
    wait_time / 1000.0    AS waiting_sec,
    wait_type             AS waittype,
    resource_description  AS ressource
FROM
    sys.dm_os_waiting_tasks
WHERE
    blocking_session_id IS NOT NULL
ORDER BY
    wait_time DESC
I also have a custom development that I will present in a later blog post, which better meets my individual requirements.
The Problem
Now I can display AdHoc blocks, but with deadlocks it gets more interesting. For this, the System Health Session must be checked, which is also volatile.
-- Query System Health Session for Deadlocks

SELECT
    event_data.value('(event/@timestamp)[1]', 'datetime2') AS DeadlockDateTime,
    event_data.query('.')                                  AS DeadlockGraph
FROM
(
    SELECT
        CAST(target_data AS XML) AS target_data
    FROM
        sys.dm_xe_session_targets AS st
    JOIN
        sys.dm_xe_sessions AS s ON s.address = st.event_session_address
    WHERE
             s.name = 'system_health'
        AND st.target_name = 'ring_buffer'
) AS data
CROSS APPLY
    target_data.nodes('//RingBufferTarget/event[@name="xml_deadlock_report"]') AS XEventData(event_data)
ORDER BY
    DeadlockDateTime DESC;
I encountered this problem with a client who was struggling enormously with deadlocks in a 3rd party application, but the support was a bit… let’s say reluctant. 😉
We had to report everything transparently to them so they would start finding a solution. Of course, query result sets can be considered transparent if you understand them or want to understand them. Unfortunately, the XML of Health Sessions or Extended Events are not exactly famous for being readable. Yet the client simply wanted the problem to be fixed.
So together we developed a reporting solution.
The Idea
With Extended Events I have XML data, and with PowerShell I can parse XML however I want, including into a report of my choice.
The Goal
We wanted a way, apart from SQL Server result sets, to overlay application problems with anomalies in the SQL Server metrics to quickly bring about solutions.
In the week after the solution went live, there were many, many „aha“ moments. From incorrectly configured ERP parameters to poor transaction handling.
The Way
Persistent Data
The most important thing is to persistently store blocking session and deadlock events. This works perfectly with Extended Events. There are two areas for this:
-- SNIPPET!!

ADD EVENT sqlserver.blocked_process_report(
    ACTION(sqlserver.client_app_name,
           sqlserver.client_hostname,
           sqlserver.database_name)
),
ADD EVENT sqlserver.xml_deadlock_report(
    ACTION(sqlserver.client_app_name,
           sqlserver.client_hostname,
           sqlserver.database_name)
)
The whole thing is configured in its own Extended Event and the recordings are already running. Nearly! We still need to configure SQL Server to treat Blocked Process as Extended Events.
EXEC sp_configure 'show advanced options', 1;
GO
RECONFIGURE;
GO
EXEC sp_configure 'blocked process threshold', '5'; -- 5 Secconds
RECONFIGURE
GO
Read Data
100% PowerShell
After the events are logged, they need to be evaluated. What immediately came to my mind were the dbatools with Read-DbaXEFile. The problem is that the currently written file cannot be read with it. You can imagine that blocking and deadlock events don’t occur in such masses that dozens of file rotations are performed within 24 hours. If they do, you definitely have a different problem than just reporting it . So we took the detour via SQL Server, since the current file can also be read here.
PowerShell + TSql
I still find it very difficult to read XML with queries, but THANKS to Brent Ozar, known to all of us, for the basic query I could build upon. At least I now had a result set for orientation and a separate XML for each event in the log.
-- Snippet
select
    *
FROM sys.fn_xe_file_target_read_file
   ('C:\temp\XEventSessions\blocked_process*.xel',
    'C:\temp\XEventSessions\blocked_process*.xem',
     null, null)
CROSS APPLY
    (SELECT CAST(event_data AS XML) AS event_data) as xevents
Finalization with PowerShell
Since I finally had my XML event, I could parse it with PowerShell, transform it, and finally package it into a nice text report.
Sql Server Deadlock Analysis | Event Time: 2025-04-08T11:16:07.447
================================================================================

SQL STATEMENTS INVOLVED
--------------------------------------------------------------------------------

    Process ID:   process261b00cfc28
    SPID:         643
    Database:     DATABASENAME
    Query:        **DETAILED QUERY**

----------------------------------------

    Process ID:   process258294fbc28
    SPID:         650
    Database:     DATABASENAME
    Query:        **DETAILED QUERY**

----------------------------------------

VICTIM LIST
--------------------------------------------------------------------------------

    Process ID:   process261b00cfc28
    SPID:         643
    Database:     DATABASENAME


PROCESS LIST
--------------------------------------------------------------------------------

    Process ID:               process261b00cfc28
    SPID:                     643
    Isolation Level:          read uncommitted (1)
    Logical Reads:            700
    Wait Resource:            KEY: 6:72058005407662080 (fb04e1bc7788)
    Wait Time (ms):           2247
    Transaction:              user_transaction
    Last Transaction Started: 2025-04-08T11:16:07.447
    Client:                   'dbserver_dll <ID@APPSERVER:34784>'
    Hostname:                 APPSERVER
    User:                     USERNAME


EXECUTED SQL STATEMENT
----------------------------------------

    **DETAILED QUERY**


Process Details
================================================================================


    Process ID:               process258294fbc28
    SPID:                     650
    Isolation Level:          read uncommitted (1)
    Logical Reads:            1904
    Wait Resource:            KEY: 6:72057996178358272 (2a9726d2d061)
    Wait Time (ms):           2278
    Transaction:              user_transaction
    Last Transaction Started: 2025-04-08T11:16:07.330
    Client:                   'dbserver_dll <ID@APPSERVER:11664>'
    Hostname:                 APPSERVER
    User:                     USERNAME


EXECUTED SQL STATEMENT
----------------------------------------

    **DETAILED QUERY**


Process Details
================================================================================


RESOURCE LIST
--------------------------------------------------------------------------------

    Resource:
        Type:               keylock
        Database:           6
        Object:             DATABASENAME.dbo.tcprmp300100
        Index:              Itcprmp300100_1a
        Lock Mode:          X
        HOBT ID:            72058005407662080
        Associated Object ID: 72058005407662080

    Owners:
        Process ID:         process258294fbc28, Mode: X

    Waiting Processes:
        Process ID:         process261b00cfc28, Mode: U, Request Type: wait

================================================================================

    Resource:
        Type:               keylock
        Database:           6
        Object:             DATABASENAME.dbo.tcprrp011100
        Index:              Itcprrp011100_1a
        Lock Mode:          X
        HOBT ID:            72057996178358272
        Associated Object ID: 72057996178358272

    Owners:
        Process ID:         process261b00cfc28, Mode: X

    Waiting Processes:
        Process ID:         process258294fbc28, Mode: U, Request Type: wait

================================================================================
Implementation
It was requested to add the results to the daily report, which we had already implemented with PowerShell. Now, it’s not great to potentially attach 200 text files to an email every morning, so the PowerShell script returns a table showing how blocks and locks occurred in time period X, and if needed, one can proactively check the folder structure.
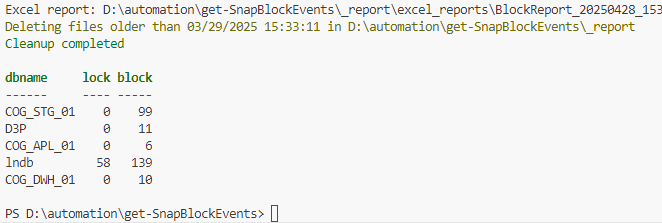
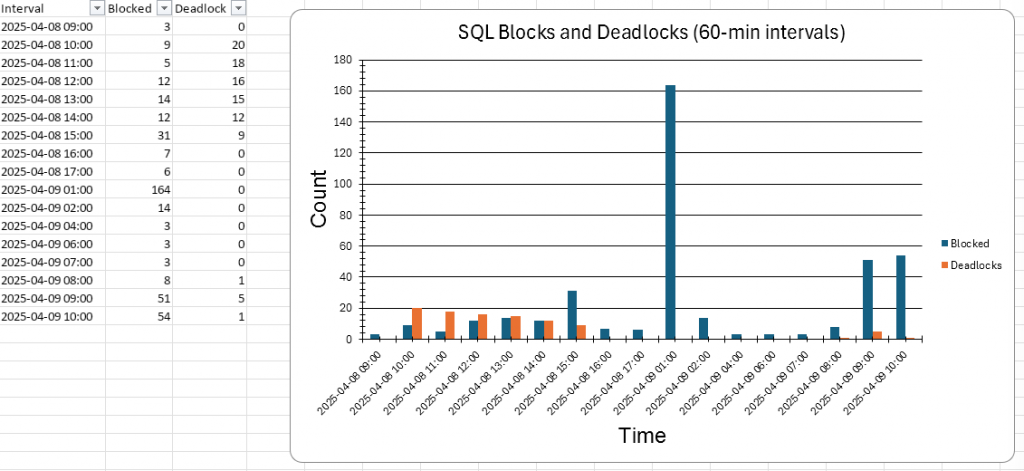
For dramatic effect and a quick overview, an Excel file is also generated. In this example, there was a nice collateral finding that the DWH jobs had serious problems 🙂
And just like that, we had a few reports that we could hand over to the vendor, and then things moved very quickly.
Die Ordner Struktur

_report/
├── text_reports/
│   └── YYYY/
│       └── MM/
│           └── DD/
│               ├── 20231120_123456_dbname_blocked.txt
│               ├── 20231120_123456_dbname_blocked.xml
│               └── 20231120_123456_dbname_deadlock.txt
└── excel_reports/
    └── BlockReport_20231120_123456.xlsx
Unfortunately, I experience again and again that application vendors think their customers are stupid and cannot operate the application. Stop doing that and believe your customers sometimes without 101% data, which you can only collect if you already have knowledge of the subject matter.
See Repository
The script has various parameters and options, details are in the README.MD. If you have questions, leave them in the comments or contact me.
Other
Erik Darling has also developed a solution to make Extended Events readable, in case other approaches are needed. (sp_HumanEvents)

Gabriel, der DBAvonNebenan