
Current Release ( 2025-10-11 )

Intro
Windows Performance Counters are absolutely powerful, but when I need something quick or monitoring tailored to a specific problem, I get frustrated fast. Usually I fall back on other options – PowerShell native Get-Counter, CIM, or existing monitoring solutions at my clients. But that’s never truly ad-hoc either, and I’ve accepted it.
Recently I had the chance to join Uwe Ricken’s Performance Tuning Workshop at DataSaturday, and he clearly named Performance Counters as a must-have in every DBA’s toolkit. What I didn’t know until then: SQL Server creates individual counters like Compile/sec, AdHoc Queries/sec, etc.

The possibilities to visualize dependencies directly – endless. But how long should I sit there configuring that in Windows Performance Monitor, especially ad-hoc at a client site?
Uwe showed the capabilities in Windows Admin Center, which enables templates you can use flexibly across servers. For systems or environments where Admin Center is used strategically, definitely a great choice.
But two problems remain: As a consultant, I can’t install software at every client, and if Admin Center happens to be running, my English templates fail on German systems.
Still, I was so incredibly hooked by the template idea and the SQL Server possibilities that 4 weeks of after-work crunchtime were spinning in my head. So let me introduce my first module in the PowerShell Gallery:
psTerminalPerfCounter 0.1.0-preview A PowerShell module for displaying real-time graphs of Windows Performance Counters directly in the terminal console. This module provides an easy way to visualize system performance metrics without requiring external graphing tools or GUI applications by using templates and multilanguage support.
You’ll find all technical details and development status in the repository – I just want to show the different possibilities here.
Main Features
100% PowerShell
- no external dependencies
Terminal Graphics
- obviously it’s not a real engine, the more counters the choppier it gets, but it’s sufficient
- The foundation comes from Prateek Singh solution. Without finding this, I would have had to solve this problem first, for which I probably wouldn’t have had time. THANKS!!!
Configuration Templates
- every output element is controlled via configuration files
- flexible, portable
Data Output Customization
- each counter in the configuration file can use its own output
- Table, Graph, or Both
- arbitrary axis scaling in steps and max values
- arbitrary value coloring based on user-defined ColorMap per counter
- value conversion via configuration file (Byte -> KB -> MB -> GB)
Language Independent
- configuration files are based on counter IDs, not paths
- portable, regardless of system language translation from ID to counter path happens at runtime
- no external dependencies
- I had no idea this was possible with Windows built-in tools. Here too I stumbled across a blog at PowerShell.ONE by chance. Again, a big THANKS!!! My original solution had multiple language variants (DE, EN, FR, ES) which would be set by reading system locale.
Demo with CPU Configuration
# Install module with required dependency (GripDevJsonSchemaValidator)
Install-Module -Name psTerminalPerfCounter -AllowPrerelease

# Import the module
Import-Module psTerminalPerfCounter

# Start Default Cpu Configuration
Start-tpcMonitor -ConfigName CPU
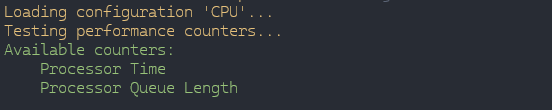
When loading the configuration, counter IDs are translated to counter paths and tested
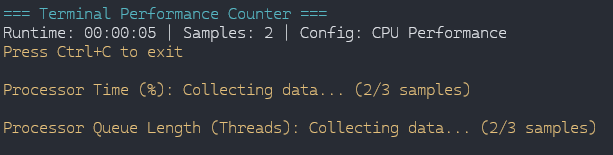
If successful, the first samples are collected so a graph can be displayed
Thats IT!
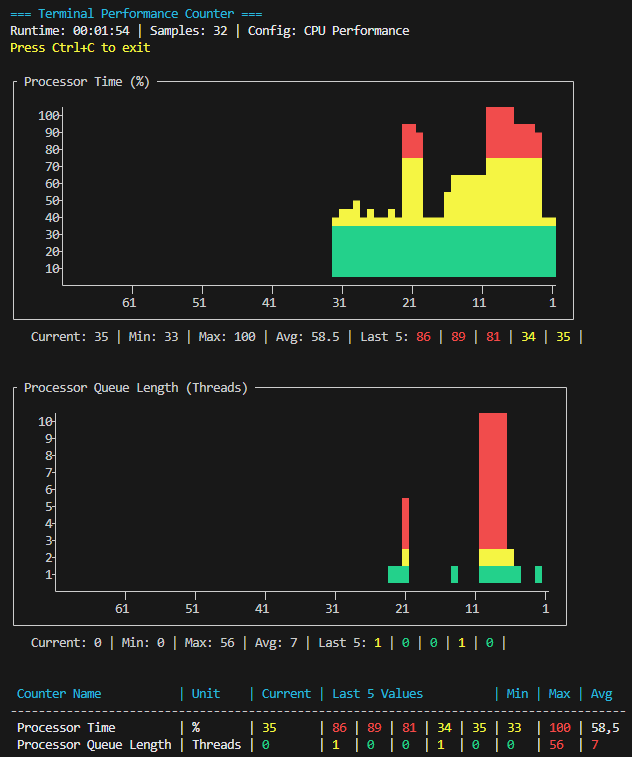
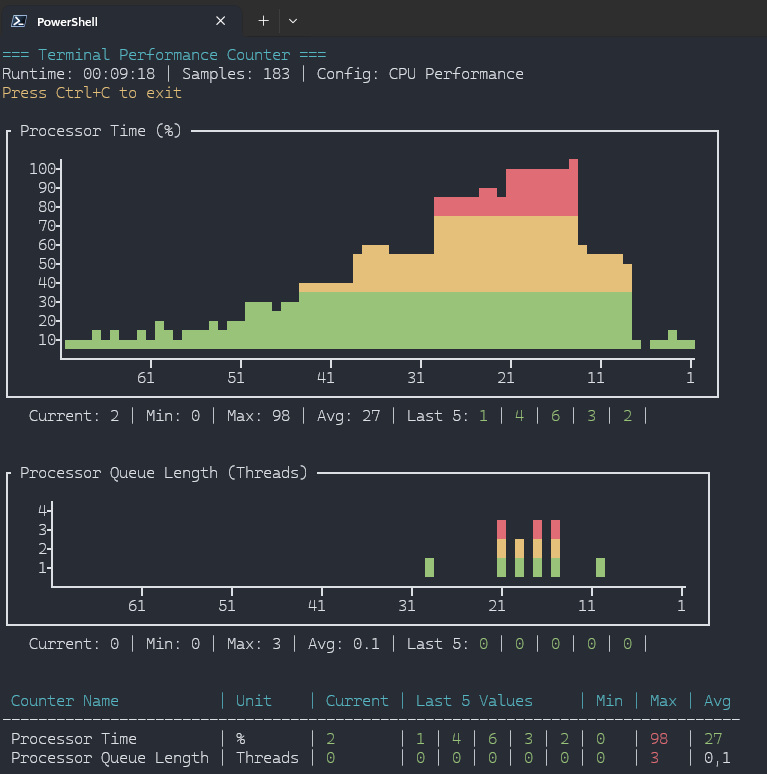
Within 10 seconds, 2 Performance Counters running, no installation, no language issues.
Demo Counter Translation
# Translate ID -> Path
Get-tpcPerformanceCounterInfo 238-6
# Search Counter -> Including ID
Get-tpcPerformanceCounterInfo "Queue"
Output is heavily truncated since the ResultSet is enormous
# Search Counter -> Including ID
Get-tpcPerformanceCounterInfo "Processor Queue"
What’s next?
The foundation works, the planned feature list is long, and what I really need for SQL Server is still far off. I hope I haven’t solved a problem that doesn’t exist, but this module simply addresses all the issues I’ve always had with Performance Counters, as mentioned above.
Furthermore, this is my first larger project that I’m developing publicly, so GitHub might not always meet expected standards. I’m always happy about feedback and suggestions.