
Intro

It has been almost a year now since I started developing psTerminalPerfCounter. Proud of the „graphical“ implementation, language independence via a 3rd-party lib and the holy grail of the time: classes in PowerShell.
None of it survived:
- Graphical implementation? Nice and colorful, but…
- Sluggish as a rock in multi-server environments
- Dynamic and scalable? Nope
- Reimplemented as a TUI (BETA)
- Multi-language via 3rd-party lib
- Turns out it all works directly through the Windows registry, stumbled across it by accident
- Turns out it all works directly through the Windows registry, stumbled across it by accident
- Classes in PowerShell? Very bad decision.
- Not practical, instances aren’t easily serializable, methods get lost, parallel remoting with runspaces barely doable
- Rebuild in C#
With the current release 0.4.1, all the features I had in my backlog are implemented for now. Since I will be lacking the time for this project over the next few months, this is a good moment to write a HowTo, because the README.md in the repo can be a bit challenging at times… as it seems 🙂 But before we get to the hands-on, let’s first talk a little about the technology and history of performance counters.
History
Windows performance counters have been around since NT 3.1 (1993), back then I didn’t even own a computer. At the time, Microsoft needed a standardized way to expose system states without every application having to implement its own monitoring mechanisms. But that also meant scraping measurement values out of the registry and calculating deltas yourself.
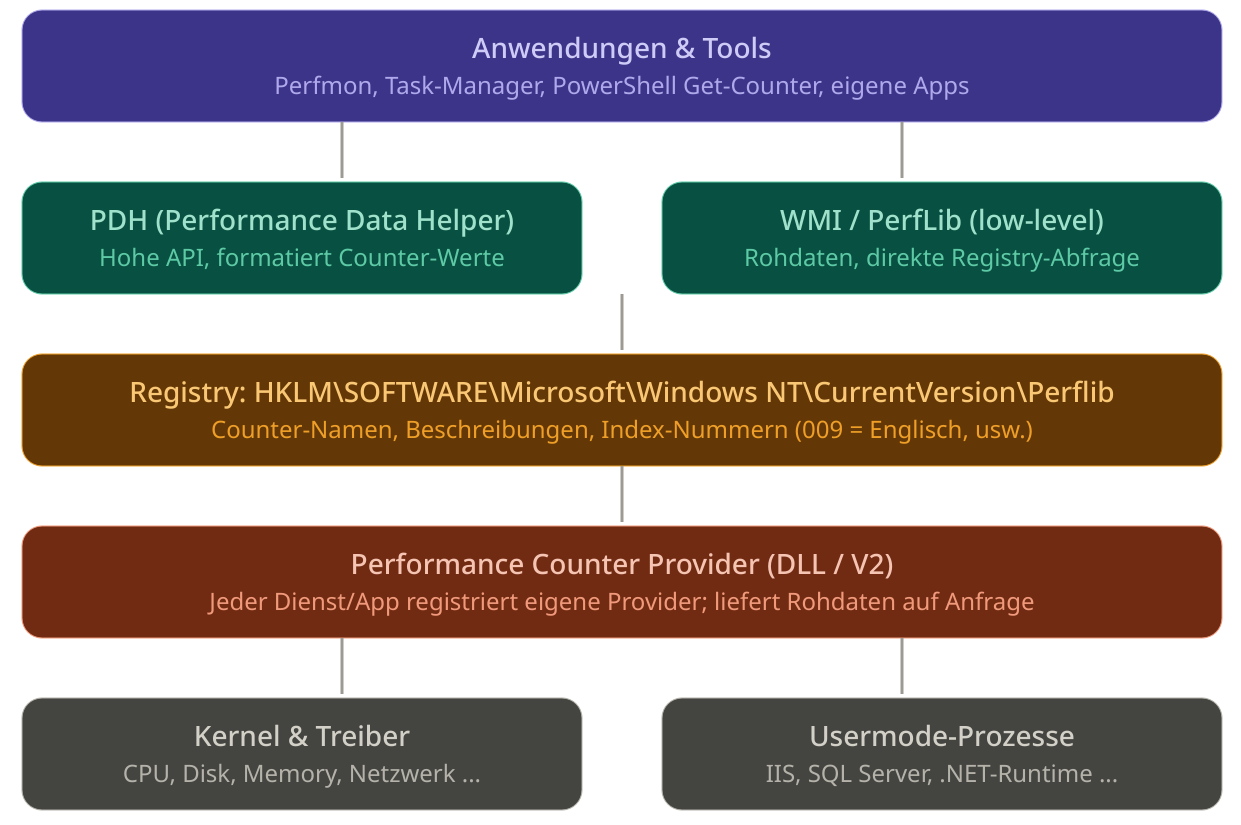
Windows 2000 added the Performance Data Helper (PDH) as a convenient high-level API, which shaped access to performance counters the way we know it today. At the same time, WMI was introduced, making performance data accessible through an object-oriented interface. CIM just wasn’t proprietary enough and a bit too compatible 😛
Windows Vista brought the revised Provider V2 model: instead of a DLL that was loaded by the system into a foreign process (error-prone, provider crash = crash of the querying process), providers now register as standalone executables or services. That is the model still in use today.
Structure and Function
Metadata in the registry
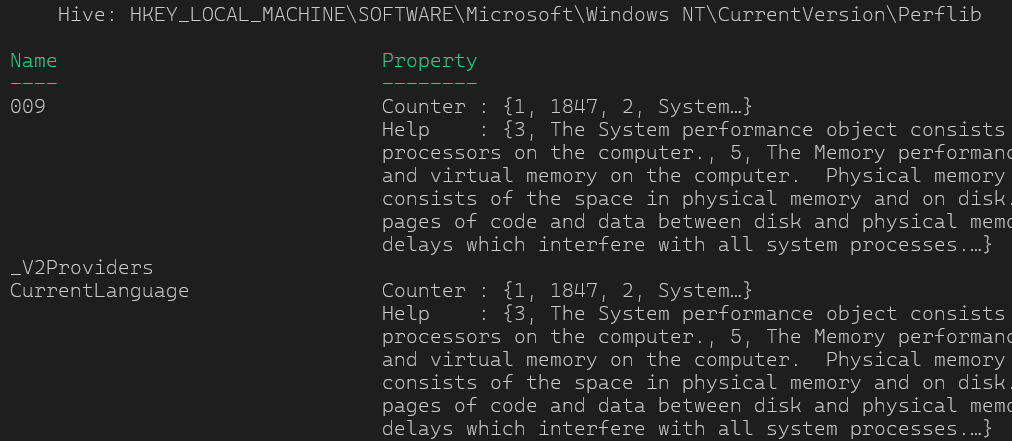
All known counters are registered under HKLM\SOFTWARE\Microsoft\Windows NT\CurrentVersion\Perflib. That’s where the name, description and a numeric index number per counter live, separated by language (subkey 009 for English, 007 for German, etc.).
# List available language packs (counter IDs)
Get-ChildItem "HKLM:\SOFTWARE\Microsoft\Windows NT\CurrentVersion\Perflib"
Providers deliver the raw data
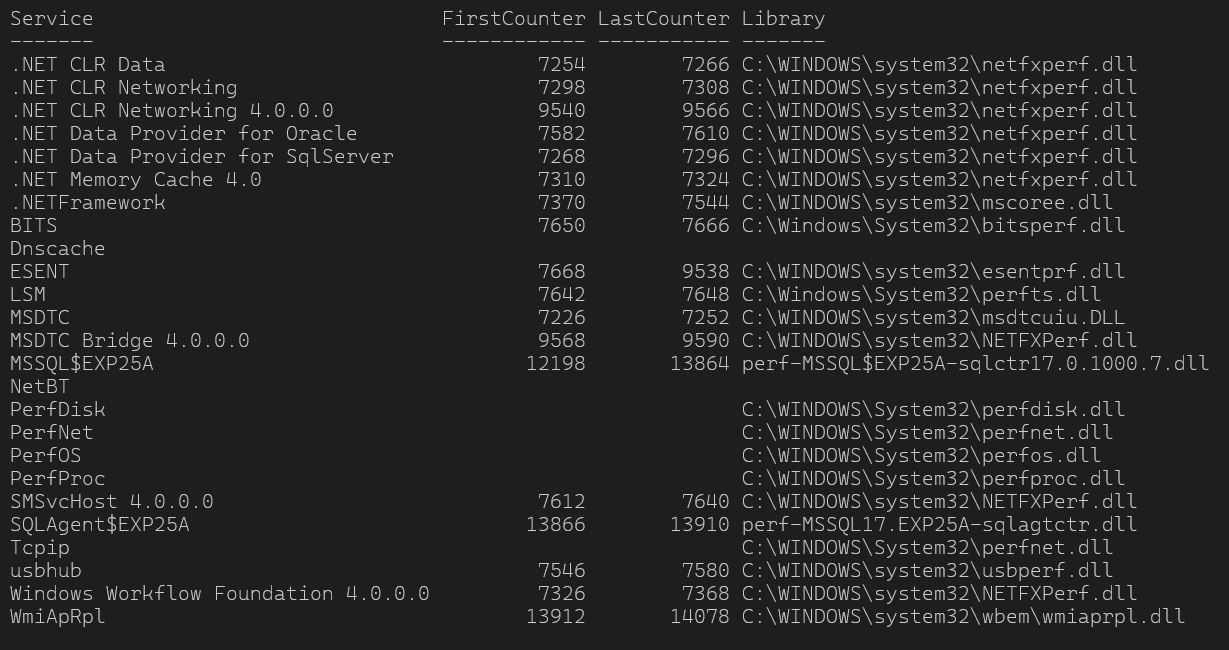
Every component (kernel, drivers, services like IIS or SQL Server, the .NET runtime) can register its own counters. The provider waits passively and only delivers data once someone queries it. There is no permanent collection service running in the background.
# List all services that have a Performance subkey

Get-ChildItem "HKLM:\SYSTEM\CurrentControlSet\Services" |
    Where-Object { Test-Path "$($_.PSPath)\Performance" } |
    ForEach-Object {
        $perf = Get-ItemProperty "$($_.PSPath)\Performance"
        [PSCustomObject]@{
            Service      = $_.PSChildName
            FirstCounter = $perf.'First Counter'
            LastCounter  = $perf.'Last Counter'
            Library      = $perf.Library
        }
    } | Format-Table -AutoSize
APIs for applications (CONSUMER)
- PDH (Performance Data Helper): The convenient API that returns values already formatted (e.g. percentages calculated, intervals taken into account).
Get-Counterin PowerShell uses PDH. - PerfLib / registry directly: Faster, but raw. WMI uses this path internally.
Structure
\Processor(_Total)\% Processor Time
└─ Object: „Processor“
└─ Instance: „_Total“ (sum of all cores)
└─ Counter: „% Processor Time“
Microsoft’s Tools
The grandfather: PerfMon
The Performance Monitor has been Microsoft’s official tool since the NT days and, for what it was built for, it is still excellent: interactive, graphical deep-dive analysis of individual systems, with recording via Data Collector Sets, CSV export via relog and basic remoting. The limits show up the moment you want to scale, automate or simply work in the terminal. Portable configuration files, keeping an eye on multiple servers at once or a structured console workflow are not its strengths.
The newcomer: Windows Admin Center
Microsoft’s browser-based management interface also comes with a performance view, cleaner than Perfmon and without a local installation on the managed system. For a quick look at CPU, memory and network that’s perfectly fine. Two things limit its practical value though: first, WAC requires a central installation, just quickly firing it up on a client or at a customer’s site isn’t an option. Second, the counter selection is based, as everywhere, on the localized PDH API, which makes workspaces not really portable.
The evergreen: Get-Counter
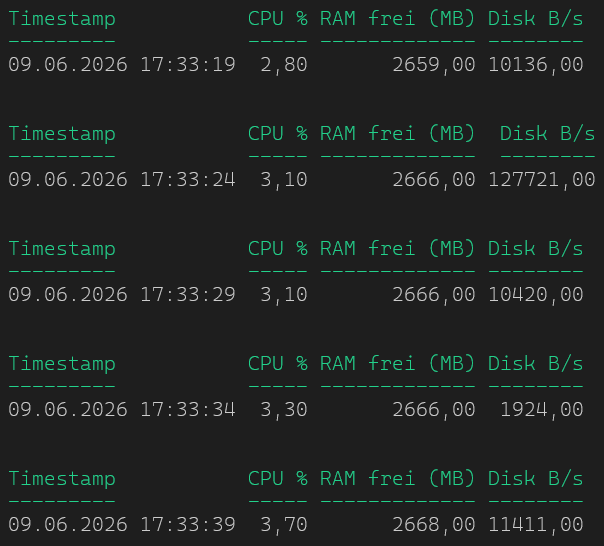
Get-Counter is the PowerShell equivalent for console use and therefore the most flexible of the three tools, as long as you’re up for some fiddling willing to get your hands dirty. Counters can be queried directly, repeated in a loop and sent down the pipeline. Remoting works via the -ComputerName parameter. The problem is the same as everywhere: the counter paths are language-dependent, a script written on a German system fails on an English one. On top of that, Get-Counter returns raw data. Formatting, thresholds, history visualization and structured output are entirely manual work. For one-off queries and quick checks it’s ideal, for reproducible, multi-language environments it quickly hits its limits.
# Query CPU, memory and disk counters every 5 seconds, format output as table
$counters = @(
    '\Processor(_Total)\% Processor Time',
    '\Memory\Available MBytes',
    '\PhysicalDisk(_Total)\Disk Bytes/sec'
)

# German Counternames
# $counters = @(
#	'\Processor(_Total)\% Processor Time',
#	'\Memory\Available MBytes',
#	'\PhysicalDisk(_Total)\Disk Bytes/sec'
# )

Get-Counter -Counter $counters -SampleInterval 5 -Continuous | ForEach-Object {
    $sample = $_.CounterSamples

    [PSCustomObject]@{
        Timestamp       = $_.Timestamp
        'CPU %'         = [math]::Round(($sample | Where-Object Path -like '*processor*').CookedValue, 1)
        'RAM frei (MB)' = [math]::Round(($sample | Where-Object Path -like '*available*').CookedValue, 0)
        'Disk B/s'      = [math]::Round(($sample | Where-Object Path -like '*disk bytes*').CookedValue, 0)
    } | Format-Table -AutoSize
}
The path to language independence
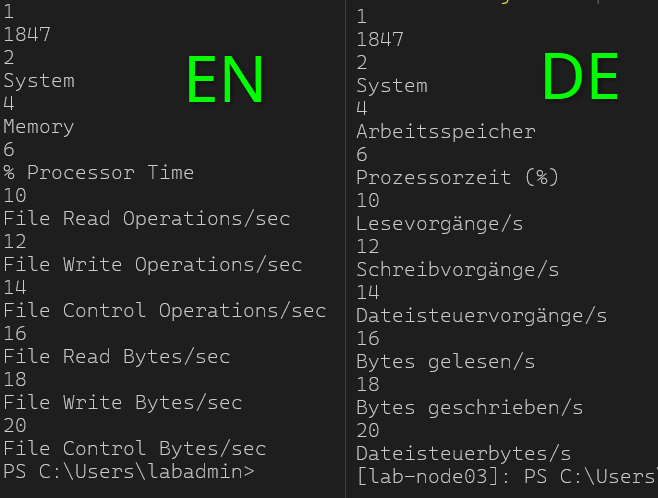
As you can see, language dependence is a big problem across all implementations. And it’s not even necessary. Under the hood, every counter object and every counter has a unique ID. Take a look at the screenshots above, there’s always a First and Last Counter. So \Processor(_Total)\Processor Time (%) –> \238(_Total)\6 .
# Read counter ID/name mapping from registry (English - key 009, German - key 007)
Get-ItemProperty -Path 'HKLM:\SOFTWARE\Microsoft\Windows NT\CurrentVersion\Perflib\009' -Name Counter |
		Select-Object -ExpandProperty Counter | Select-Object -First 20
That’s it. The counter object and the path just need to be translated once and I’ve got my language-independent counter path. Before execution it gets translated on the target system and then Get-Counter -Counter <TRANSLATION> is run. In psTerminalPerfCounter this is handled by the cmdlet get-tpcPerformanceCounterInfo

Schreibe einen Kommentar